Since the outbreak of the Russian-Ukrainian war in 2022, the European photovoltaic (PV) market has surged. This rapid expansion triggered a worldwide oversupply of solar modules by mid-2023, with prices plunging below production costs. Amid this volatility, fierce competition among solar cell manufacturers has driven technological innovation at an unprecedented pace. In today’s market, survival depends on outperforming the rest.
Recent Advancements in Solar Panel Efficiency
Impact of Solar Cell Size on Efficiency and Cost Reduction
The efficiency of commercial solar panels typically ranges from 18% to 22%, and some can even reach up to 24%. Solar technology has had many advancements over the years, and researchers continue to push the boundaries forward.
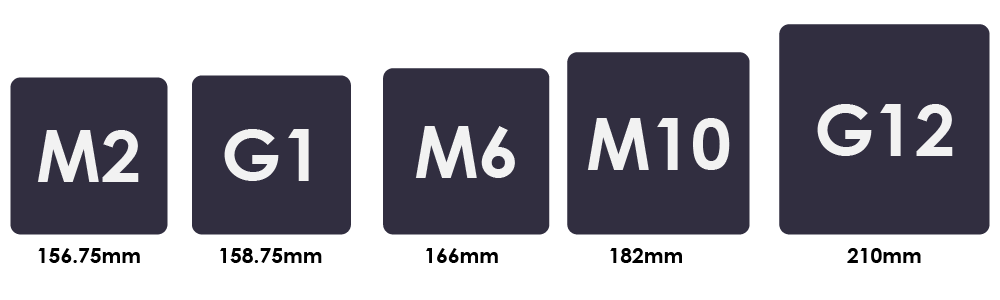
The larger the size of the solar cell, the higher the power and the lower the cost of PV. The silicon industry repeatedly introduced larger size wafers, starting from M2 (2016), via G1 (2018), M6 (2019), M10 (2020) to G12 (2021). Meanwhile, efficiencies increased as well, which is an extra advantage in lowering the cost of PV. In 2015, solar cells were mostly made from 156 x 156 mm p-type polysilicon cells with a conversion ratio of roughly 17%. Around 2018, the production of solar cells completely switched to p-type monocrystalline M2 and G1 solar cells. Their efficiency had already touched upon 20% by then.
Introduction to PERC Solar Cell Technology
In 2019 PERC (Passivated Emitter and Rear Contact) solar cell technology was introduced onto 166 x 166mm M6 wafers. In a PERC solar cell, the rear surface is passivated with a dielectric layer, which reduces recombination losses and reflects unused light back into the cell. This results in an increase in current generation of about 10% (relative) compared to G1 solar cells made before. The key advantage of PERC technology is its ability to boost efficiency without significantly increasing manufacturing complexity or cost.
Challenges and Solutions in N-Type Solar Cells
By 2019 it was already well understood that n-type wafers were essential to make efficiency leaps forward, but there were too many burdens to do so, for example insufficient availability of n-type wafers and the implementation of complex semiconductor processes. This had to be resolved first. Therefore, solar cell manufacturing focused on increasing the size of solar cells. The idea was twofold. First, this method helps to improve the (Wp and thus financial) throughput of solar cell production lines without a necessity for huge equipment investments. Secondly, this method helps to improve the process quality of solar cell manufacturing over larger surface areas. This is one of the key steps in further improving solar cell efficiencies. In 2021, solar cell and module producer Trina Solar announced the achievement of commercial mass production of 210mm x 210mm G12 PERC solar cells with an efficiency of 22,5-23,0%.
The Rise of TOPCon Solar Cells and Efficiency Gains
tThe mass scale production of n-type based TOPCon (Tunneling Oxide Passivated Contact) solar cell took off in 2022. TOPCon solar cells make use of a thin oxide layer and a polycrystalline silicon layer to create a highly passivated contact. This design allows for improved passivation and yet excellent charge carrier extraction, resulting in higher energy conversion rates. TOPCon solar cells have become widely available since 2024 in a variety of dimensions in the M10RT and G12 range (182×182, 182×184, 182×188, 182×199 and 182×210 mm). Commercially available TOPCon solar cells have an efficiency in the range of 24,5-25,5%.
The Next Step: IBC Solar Cells and Their Potential
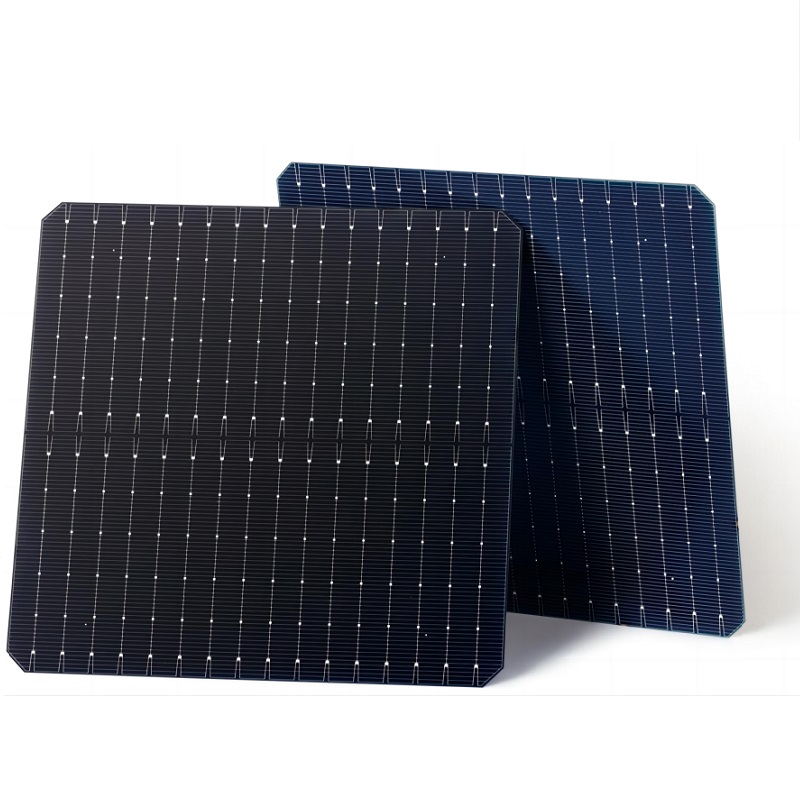
So far, all solar cell types have the commonality of having front and rearside contacts. This commonality allows for cell generation implementations in modules without a need for high equipment investments by module manufacturers. However, the front-side metallization covers 4-5% of the available area for current collection. IBC (Interdigitated Back-Contact) solar cells shift all contacts to the back. This is what is happening right now in 2025. The first IBC solar cells and modules are entering the solar market. Cell efficiencies already go beyond 26%. As a bonus, modules get a full black appearance.
What can we expect beyond IBC solar cell technology? With 27% solar cell efficiency we are getting very close to the fundamental limit which is somewhere near 31% efficiency with silicon as a substrate material. It is not yet clear whether the PV market will adopt heterojunction solar cells or tandem cell structures. There is still a lot of research needed to come to conclusions. One of the probable candidates is to use a thin film layer of perovskite on top of silicon solar cells. Perovskites absorb different wavelengths of light from those absorbed by silicon cells. When silicon and perovskites work together in tandem solar cells, they can utilize more of the solar spectrum, producing more electricity per cell.
Future of Solar Cell Efficiency: Perovskite Tandem Cells
Perovskite tandem cells have already exceeded 33% efficiency in the lab. That is an exciting promise. But the electrochemical makeup of perovskites means they are sensitive to moisture and heat degradation. Ongoing research focuses on moisture barriers and more stable perovskite compounds to match the multi decade lifetime of silicon solar modules. It will still take several years before we can expect commercial perovskite-silicon tandem modules.
Recent Advancements
in Solar Panel Efficiency
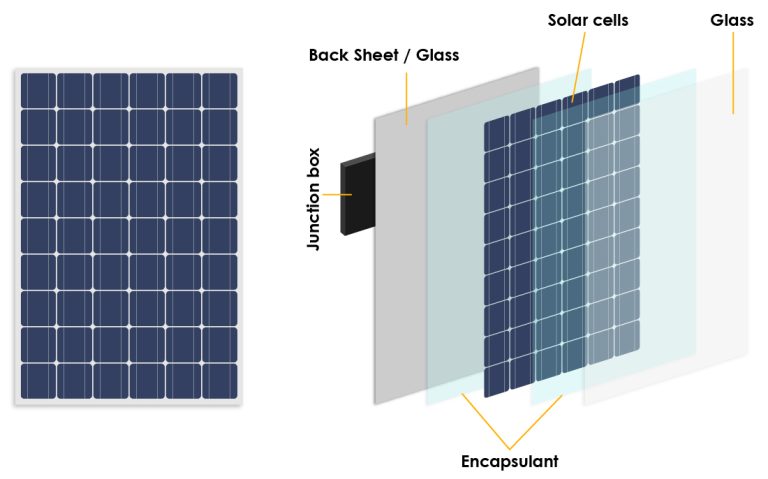
Key Components of Solar Modules
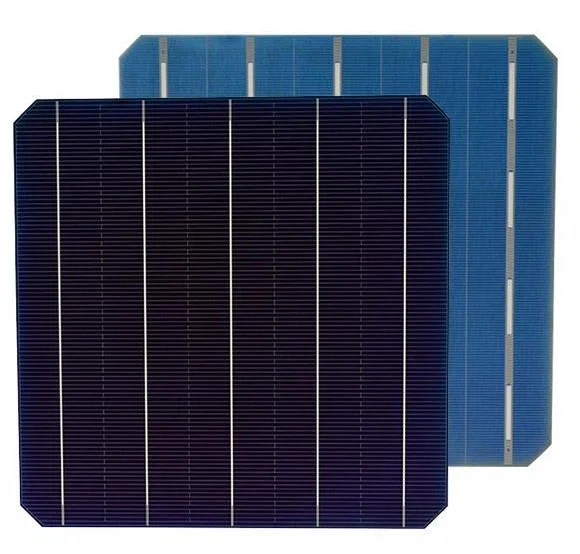
A standard solar module consists of a number of interconnected solar cells encapsulated into a laminate. A frame is mounted around the perimeter of the laminate to make it a sturdy module. The two key functions of encapsulation are to prevent mechanical damage to the solar cells and to prevent moisture ingress from corroding the electrical contacts. Solar cells are only 150µm thin which makes them vulnerable to mechanical damage unless protected. In addition, the contact areas on the solar cell itself can be damaged easily by moisture ingress.
The Role of Encapsulation in Solar Cell Protection
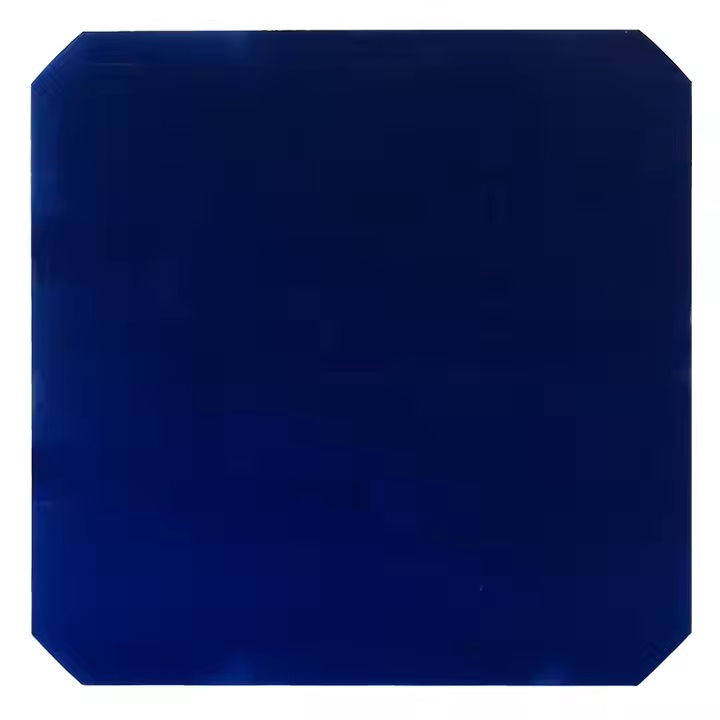
The front-side layer usually consists of a strong glass sheet. When fully tempered, the front-side glass will survive hail strikes. Glass is a perfect material for solar applications. Apart from its strength, it has high transmission for sunlight, it is a perfect water barrier and UV stable. The main purpose of the front-side glass sheet is to guide as much light as possible towards the solar cells. Surface treatment technologies such as AR (anti-reflective) coating and texture are widely applied in the industry.
The Evolution of Solar Module Size and Design
The larger the size of the solar module, the higher the power and the lower the cost of PV. Even though the module design hasn’t really changed over the past 50 years, module dimensions kept growing. This is the third key factor in aiding PV cost reduction. A “practical 25kg” weight limit occurs when a solar module reaches about 2 m² in size. Beyond 25kg, solar modules are considered no longer easy to handle. This weight limit has led to module designs with a light-weight moisture-barrier backsheet foil. These backsheet foils contain fluorised polymers to give them excellent weatherability properties. The fragility of the newer generations’ solar cells and the requirement to reduce environmental impact leads to a change from glass-foil modules towards glass-glass modules.
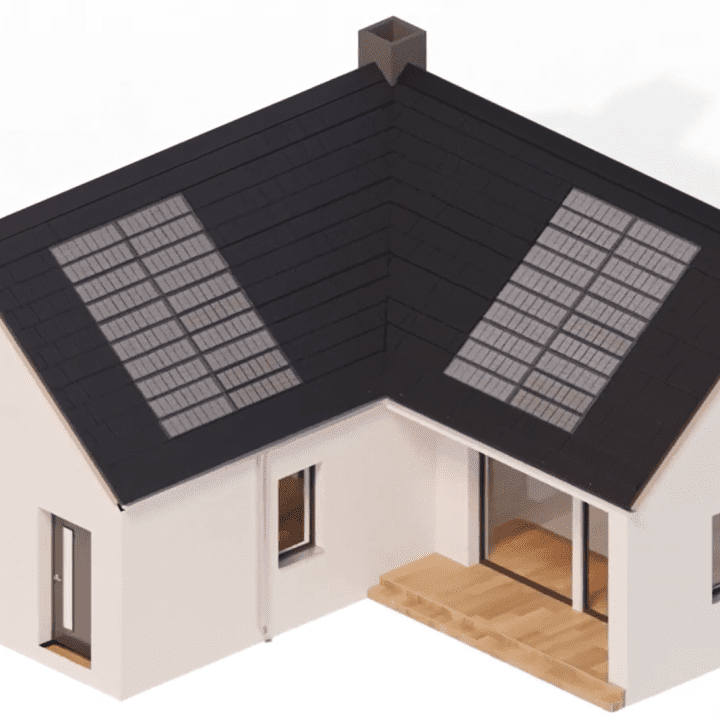
BIPV (Building-Integrated Photovoltaics) Modules and Their Benefits
To mitigate the additional weight of a rearside glass sheet, glass-glass modules are nowadays mostly manufactured from 2 layers of 2mm glass for otherwise the module dimensions have to be reduced by roughly 25%. But the strength of 2mm glass is significantly less than for 3,2mm glass, especially in the corner areas. The local weather conditions will dictate whether the thinner 2mm glass layers will survive 25 years lifetime. For north-western Europe we (Solinso) do not recommend using 2mm front-side glass because the likelihood of destructive forces due to hail or snow is large enough to destroy the module during service life.
Solinso offers relatively small BIPV modules to the market with a size of roughly 0,5m². This means that weight is never a limit and that the BIPV elements are easy to handle on roofs.

Glass-Surface Treatment Technologies for Solar Modules
At the moment (2024) we see that there is a lot of development in additional glass-surface treatment technologies. After cutting glass sheets to application size, the sheet can be screen printed with inks which are subsequently baked into the glass during the glass-hardening process. Coloring glass implies we can make colored modules.
Anti-Glare Glass and Its Impact on Solar Energy Yield
Also, glass can be made ultra-matt or anti-glare to take away sunlight reflections.
Several types of glass textures are available, varying from standard light solar texture to very strong textures. Apart from cost, a possible downside of texture is soiling, especially in environments where dust and dirt can build up over time. In areas where there is regular rainfall, there are only benefits: better looks and better energy yield performance.
Developments
in Solar Systems
To circle back to the beginning of this article, solar systems need to be designed to maximize cost savings for our customers. In most cases, solar system designers tend to maximize for energy output which is not the same approach.
Specific yield (kWh/kWp) is one of the most commonly used performance metrics for solar systems of all sizes. It’s used to compare different locations, to analyze different designs or to assess the health of a solar system. Customers frequently ask “What’s a good value for kWh/kWp?” The answer is not straightforward. And it may even not be the right question because the true value lies in the financial savings customers see on their energy bill. With a variable tariff structure it may actually be better to design an east-west oriented solar system because energy tariffs can go very low during the midst of the day.
Factors that impact specific yield
Specific yield refers to how much energy (kWh) is produced for every kWp of solar modules installed over the course of a year. In north-western Europe, specifically the Netherlands and Germany, typical values can range from 800 to 1,100 kWh/kWp. The actual value is driven by many factors, including:
1
Location
The project location determines the amount of sunlight, or irradiance, will generally be received. Irradiance is usually the biggest driver of specific yield but the irradiance can still vary a lot, up to 10% per year. For example, Munich in southern germany, can receive the equivalent of 1250 sunny hours of sunshine per year while Hamburg in the northern part of Germany only receives 1050 kWh/m2 of annual global horizontal irradiance. Irradiance not only depends on the project location but also on surrounding conditions. For example, shading from trees, dormers or chimneys. Also, local weather conditions may affect the energy yield. Soiling in dry periods and/or snow cover in the winter period will block some of the incoming irradiance.
2
Module orientation
The project location determines the amount of sunlight, or irradiance, will generally be received. Irradiance is usually the biggest driver of specific yield but the irradiance can still vary a lot, up to 10% per year. For example, Munich in southern germany, can receive the equivalent of 1250 sunny hours of sunshine per year while Hamburg in the northern part of Germany only receives 1050 kWh/m2 of annual global horizontal irradiance. Irradiance not only depends on the project location but also on surrounding conditions. For example, shading from trees, dormers or chimneys. Also, local weather conditions may affect the energy yield. Soiling in dry periods and/or snow cover in the winter period will block some of the incoming irradiance.
3
Module design
The 2 most important factors contributing to this gain are LID (Light Induced Degradation) and temperature performance. p-type PERC solar cells tend to lose 3% of peak power performance very soon after installation due to the so-called LID effect. All modules lose efficiency when they heat up, but they lose efficiency at different rates. Temperature performance in particular can make a real difference; TOPCon cells have a significantly lower sensitivity to temperature which can improve the yield of a solar system by as much as 1-2% when compared with PERC modules. Temperature performance is also one of the key factors why solar systems in coastal regions perform better than inland. It is more windy and the low sea temperature when compared with temperatures inland helps to keep modules cooler than their inland counterparts.
4
Balance of system efficiency
BOS efficiency includes inverter efficiency, inverter clipping, MPP tracking losses, DC and AC wire losses, mismatch losses etc. Adding these factors up accounts for 10% annual kWh loss easily.
| Power guarantee: | 97% of the initial power output after 1 year |
| 90% of the initial power output after 10 year | |
| 80% of the initial power output after 25 year |
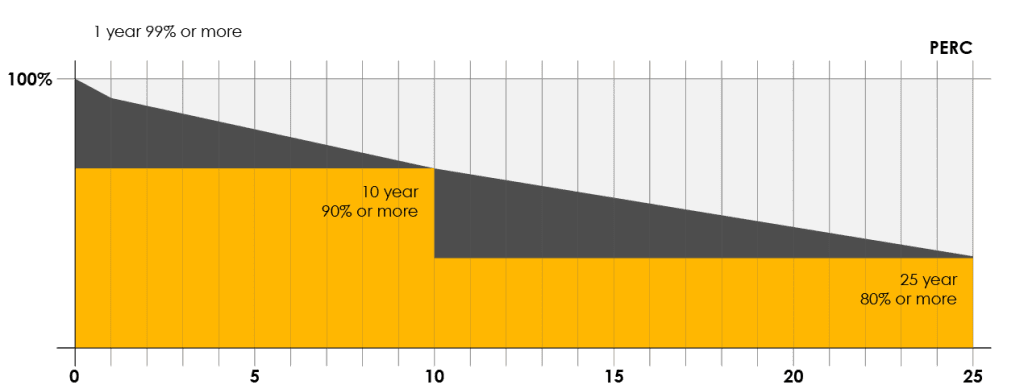
| Power guarantee: | 99% of the initial power output after 1 year |
| 93% of the initial power output after 10 year | |
| 83% of the initial power output after 25 year |

Typical kWh/kWp values
Now that we’ve defined the drivers of yield, let’s drill down to yield values for a couple of real examples to see how location, weather file and design individually impact yield, starting with location.
Finally, design is usually the biggest driver of yield at your control. While there are infinite design options, we’ll stick to five representative designs, as shown in Table 1.
In each location, there’s a difference of 20% or more between the lowest yield design and the highest yield design (that is, between the high-shade residential design and the utility design). All of these designs have different impacts of shading, temperature and even plane-of-array orientation adjustments.
Expectations
Many solar developers have a sense for the kWh/kWp yield they expect to see based on their own history. But not many appreciate how those will vary based on the location, the system type or even the weather file used. As with everything in solar, the devil is in the details!